by Donny Thurston
Think about the difference, for students, of graphing several equations at once, versus adding one equation and graph at a time.
Graph an animation with GC 3.5 or GC 4.0, letting n range from - 4 to 4 using the equation
y = x + n
Think about when there would be a purpose to use an animation over a range rather than showing multiple graphs.
Technology has afforded us new and exciting ways of teaching mathematics. As computers, applets, and software becomes increasingly ubiquitous in or world, mathematics educators have been developing innovative was to use these new trends to help students develop a greater understand or "sense" of mathematics.
This write-up, taken from the first several items from Exploration #0 found here, will explore the different methods of representing mathematics using technology, and how some of the advantages of technology can be used to improve a student's understanding of mathematics beyond that which can be done with a paper and pencil.
This exploration will focus on the difference between graphing different functions serially, concurrently, and representing a range of functions in an animation. These methods will afford different opportunities and conceptual understandings of the mathematics involved, and some teaching applications will be discussed.
First, let us consider how the most traditional method of helping students learn about functions, that is: graphing them one at a time, often on separate figures.
For instance, let us graph y = x + 2
Here, let us make some observations, playing the role of the student. First, we can observe an x-intercept of -2 and a y-intercept of 2. It as a slope of 1. Little else is interesting about this graph.
So let us explore more and graph another, like y = x - 1
An observant student will notice the important differences, such as the different intercepts or the same slope. However, representing the graphs in such a disparate manner do little to help students conceptualize a change between the graphs. An understanding that as a constant changes so does the graph.
Let us then, include a large number of graphs together, including a list of functions to that we can see how they associate.
This exercise helps students intuit much more about how the role of n in the equation y = x + n. In many ways, students can observe how can observe how a varying constant influences the graph, and may even be able to conceptualize the graph "moving" as n varies.
Let us see how an animation can bring even more clarity to the situation.
As we see here, students can actually observe the literal change in the graph as n changes. This helps reinforce the idea that n can be any real number, and it would have a representation that of y = x + n that exists only for that n.
However, the animation does not offer much more than that. For the most part, I would argue that the animation does not offer very much more than the image with several different values of n. However, just because that may be true for a function as simple as this, it is not necessarily true for more complex functions. In fact, let us explore a function that, while it is only slightly more complex than this one, yields some very interesting truths that are much easier to detect using animation.
Let us consider equations of the form :
In this equation, we have up to three constants that can vary, all producing a variant of a parabola.
I suggest that for one of the variables, c, animation helps a student understand what is going on, but not very much more than several representatives of a graph. However, the variables a and b is best understood through an animation. I will demonstrate why I think that this is true.
This is a range of graphs for the equation,
, with an a and b of 1, and a varying c.
There is no doubt that this is an interesting range of values, and that students will benefit greatly from this representation of functions. Notice how the graph shifts, apparently without changing shape, in a vertical fashion with the change in c. This is done because the variable c is not dependent on any x, or input, value. Only the y value, the output, in influenced, and so the graph "moves" along the y-axis.
i.e. if f(x) = x^2 + x, and y = f(x), then x^2 + x + c = f(x) + c = y + c
An animation for the variance of c may demonstrate the "move" just as it did in the previous section with the linear function, but I suggest that it will not do very much more because the move is already easy to conceptualize. It is linear and even. However, when other constants in the graph vary, the difference is not always so easy to capture in a still image.
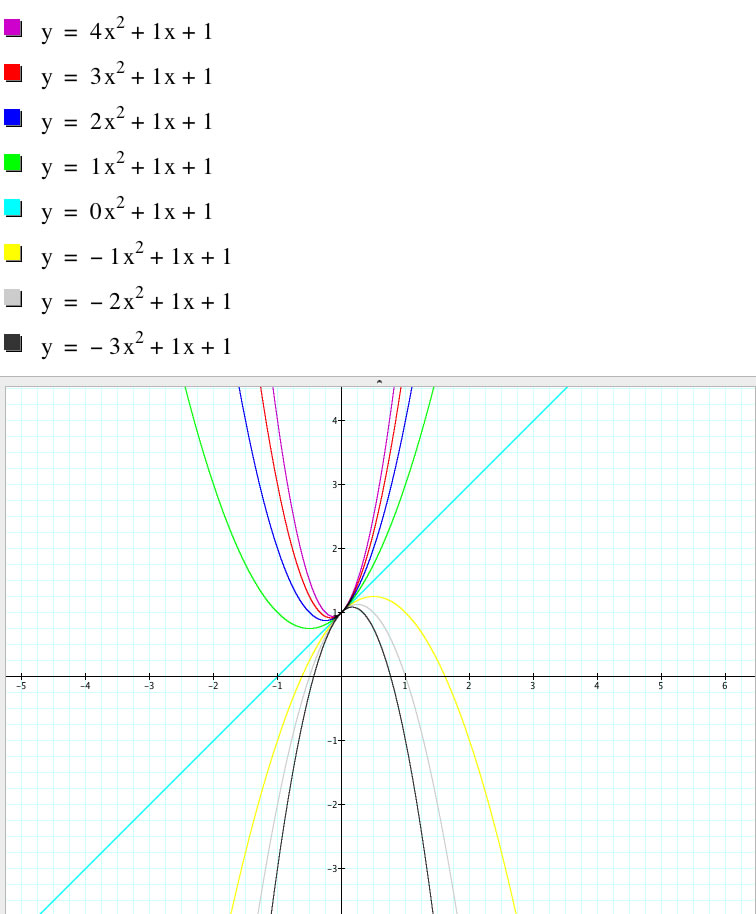
This is a range of graphs for the equation,
An astute student may notice that a is clearly linked to the "steepness" of the parabola. In addition, it may be clear that the a = 0 point is simply the same as the function y = x + 1, since 0x^2 = 0. However, with such a digital representation of the varying values of a, it is difficult to develop a strong conceptualization of the impact that varying values of a really had on the graph. Let us see if an animation paints a better picture.
Here we can see exactly how the a interacts with the function. Seeing a continuous representation of a helps students better understand several features of the function. First, the influence of a does not seem to be equally obvious within any interval of a. For instance, as a grows closer to 0, it seems to have much greater impact on the graph. In addition, we can also observe that positive and negative a does not simply result in a direct "reflection" of the graph. Instead, as we observe a approach zero, we see that the graph actually approaches the line y = x + 1, before turning concave down.
This helps develop a much better conceptualization of the role of a in the quadratic function, and even offers some other interesting observations. For instance, the animation helps bring out a question "Do the graphs have a common point?" In the figure with all of the graphs on it at once, it is hard to determine exactly which point that may be, or if there is only one, but the animation does a much better job of showing that, in fact, there is. See a complete treatment of that question here.
So then what about varying values for b? This constant can be particularly hard for students to understand, since, while it has an important role in relating y to x, it does not have quite an obvious one. Even in the quadratic formula, the role of b appears to be sideline to a. Lets see the figure.
So, something is happening here. However, it is definitely not obvious as to what exactly that is. It appears that the shape may not change in between graphs, but that is not clear, especially for smaller values of b, and the graphs follow some sort of pattern on either side of b = 0, but it is not obvious. Can an animation help?
It is much easier to answer some of those questions now. First, while the graph certainly moves, it does not appear that the shape of the parabola actually changes. This is because of the linear relationship that b has with y. It is the a that adjusts the "shape" of the parabola because it is the x^2 that actually determines the shape, because we define the shape as the rate that y increases in relation to x. While b (with the help of c) influences where the vertex of the graph is located, once the vertex has been established, the a determines the "steepness" of the graph, which is also what we most commonly associate with shape (distinct from translation).
That isn't the only relationship we can see here, however. We also can observe the path that the vertex of the graph takes as b changes. While it is not obvious from the figure, the animation shows something more. It is not linear, or even an absolute function. It appears to take the path of a parabola! Is this right?
This kind of relationship can be an excellent point of exploration and discussion for students, and it is made possible by using technology and animation to help develop understanding in students. An exploration of the path that a quadratic function takes (using animations to help) is found here.